Fuster Franck
Maître de Conférences à la Faculté des Sciences et Ingénierie, Sorbonne Université.
Manual
Visualization
 | In order to visualize, first create a color code file with the bas_to_syn utility program. According to your data analyzer, we recommend Amira and Molekel (version 4), generate either title_elf.cube and title_esynf.cube files with the sbf_to_cube utility for Molekel. The sbf_to_am utility converts the sbf files to the am format readable by Amira. |
sbf_to_cube
Run sbf_to_cube for the elf and syn sbf files.
- filein (a40) : wfn file name
- filesbf(a40) : sbf file to be converted
- ix,iy,iz : step size in each direction (standard 1 1 1)
sbf_to_am
Run sbf_to_am for the elf and syn sbf files.
- filesbf(a40) : sbf file to be converted
Molecular visualization program
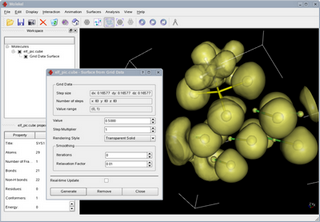
Molekel is an Avanced Interactive 3D-graphics package for visulizing molecular and electronic structure data from output of various Quantum Chemistry softwares such as GAUSSIAN94/98, GAMESS-US,ADF, HONDO. It works under UNIX, LINUX and also WINDOWS. It uses the Open/GL, Mesa, GLUT and GLUI libraries. MOLEKEL was designed and developed at University of Geneva and CSCS / ETHZ by Peter F. Flükiger in the early 90ties and later by Stefan Portmann. A ppt file explains how to use Molekel. The syn.rgb file in the SYN directory provides the texture and color codes.
Molekel is available at the following URL:
https://ugovaretto.github.io/molekel/
Amira wThermo Scientific Amira Software is a powerful, multifaceted 2D-5D platform for visualizing, manipulating, and understanding life science research data from many image modalities, including CT, MRI, 3D Microscopy, and other techniques. The syn.am file in the SYN directory provides the texture and color codes.
The following URL provides useful piece of information and enable to download a documentation brochure and a free trial : Thermo Scientific™ Amira™ Software
- PyMOL is a user-sponsored molecular visualization system on an open-source foundation, maintained and distributed by Schrödinger.
PyMol is available at the following URL: www.pymol.org.
For Pymol and ELF see Ramp new. Ramp_new creates a color ramp based on a map potential value or based on proximity to a molecular object.
ParaView is an open-source, multi-platform data analysis and visualization application. ParaView users can quickly build visualizations to analyze their data using qualitative and quantitative techniques. The data exploration can be done interactively in 3D or programmatically using ParaView’s batch processing capabilities.
ParaView is available at the following URL:
https://www.paraview.org/
VESTA is a 3D visualization program for structural models, volumetric data such as electron/nuclear densities, and crystal morphologies.
VESTA is available at the following URL:
http://jp-minerals.org/vesta/en/
back
Molekel is an Avanced Interactive 3D-graphics package for visulizing molecular and electronic structure data from output of various Quantum Chemistry softwares such as GAUSSIAN94/98, GAMESS-US,ADF, HONDO. It works under UNIX, LINUX and also WINDOWS. It uses the Open/GL, Mesa, GLUT and GLUI libraries. MOLEKEL was designed and developed at University of Geneva and CSCS / ETHZ by Peter F. Flükiger in the early 90ties and later by Stefan Portmann. A ppt file explains how to use Molekel. The syn.rgb file in the SYN directory provides the texture and color codes.
Molekel is available at the following URL: https://ugovaretto.github.io/molekel/
Amira wThermo Scientific Amira Software is a powerful, multifaceted 2D-5D platform for visualizing, manipulating, and understanding life science research data from many image modalities, including CT, MRI, 3D Microscopy, and other techniques. The syn.am file in the SYN directory provides the texture and color codes.
The following URL provides useful piece of information and enable to download a documentation brochure and a free trial : Thermo Scientific™ Amira™ Software
PyMol is available at the following URL: www.pymol.org.
For Pymol and ELF see Ramp new. Ramp_new creates a color ramp based on a map potential value or based on proximity to a molecular object.
ParaView is an open-source, multi-platform data analysis and visualization application. ParaView users can quickly build visualizations to analyze their data using qualitative and quantitative techniques. The data exploration can be done interactively in 3D or programmatically using ParaView’s batch processing capabilities.
ParaView is available at the following URL: https://www.paraview.org/
VESTA is a 3D visualization program for structural models, volumetric data such as electron/nuclear densities, and crystal morphologies.
VESTA is available at the following URL: http://jp-minerals.org/vesta/en/