N C I
What is new in NCIPLOT?
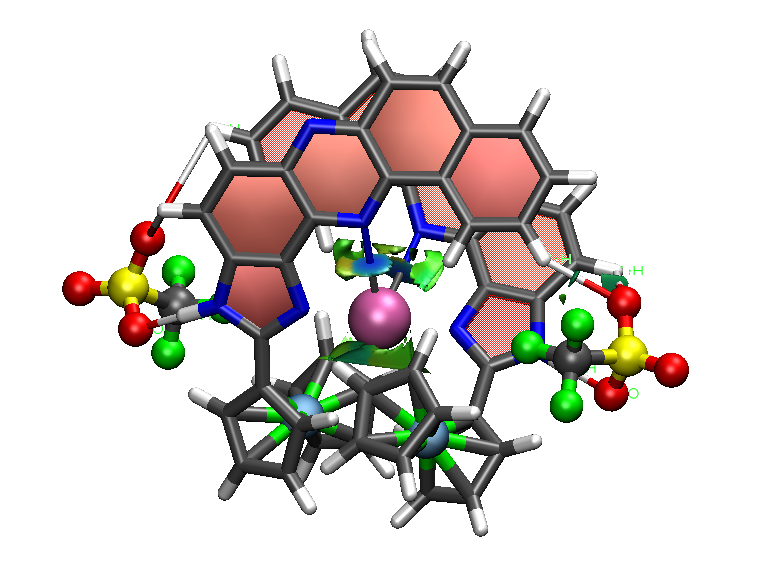
NCIPLOT enables graphical visualization of NCI in molecules.
NCIPLOT computes density and reduced density gradient (RDG) on a grid and provides Gaussian-format cube files and VMD scripts for the direct visualization of the results. It can be run using either SCF densities (wfn input files) or promolecular densities (xyz input files), which makes it applicable to large biosystems.
If you use this program, please cite us as:
- Erin R. Johnson, Shahar Keinan, Paula Mori-Sanchez, Julia Contreras-Garcia, Aron J. Cohen, and Weitao Yang, J. Am. Chem. Soc. 2010, 132, pp 6498-6506.
- J. Contreras-Garcia, E. R. Johnson, S. Keinan, R. Chaudret, J-P. Piquemal, D. N. Beratan, and W. Yang. J. Chem. Theory Comput. 2011, 7, pp 625-632.
What is new in NCIPLOT-4.3?
What is new in NCIPLOT-4.2?
NCIPLOT-4.n versions
Important: Use of version 4.2 is recommended. Two bugs for advanced users have been detected in version 4.0:**Thank you Erna Wieduwilt for pointing them out!
These bugs are fixed in version 4.2:
Other programs, types of calculation, versions
Several programs are now available depending on your type of calculation (and even from experimental densities). Please check:- For old versions, please go to the NCIPLOT tab.
- For solid or MD calculations, please go to the Other programs tab.
- For tips and useful scripts, such as NCI coupling to ELF, please to to the Useful tips and scripts tab.